
Table of Contents
Do not index
View Pie Charts from the Responses Page
Step 1: Open Your Form
Go to Google Forms. Select your form.
Step 2: Navigate to Responses
Click
Responses on the top menu. Locate your multiple choice and dropdown questions. Google Forms automatically shows a collective Summary of the answers under these question types as a pie chart.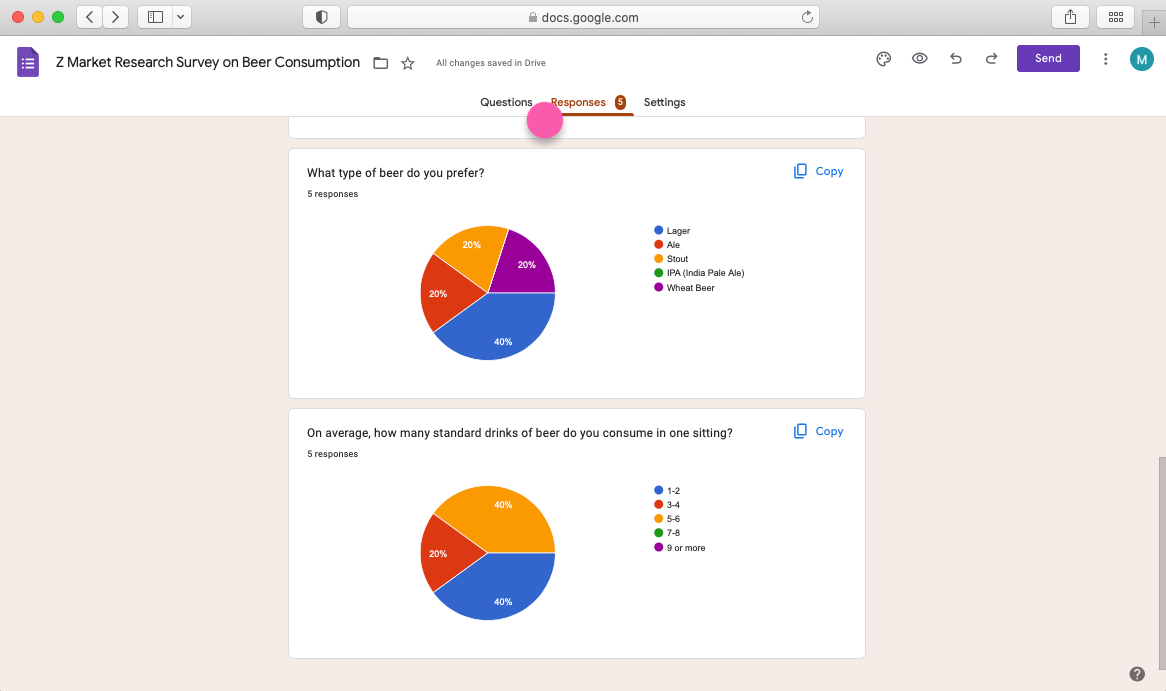
Create a Pie Chart in Google Sheets
Step 1: Navigate to Responses
Go to
Responses, then click Link to Sheets.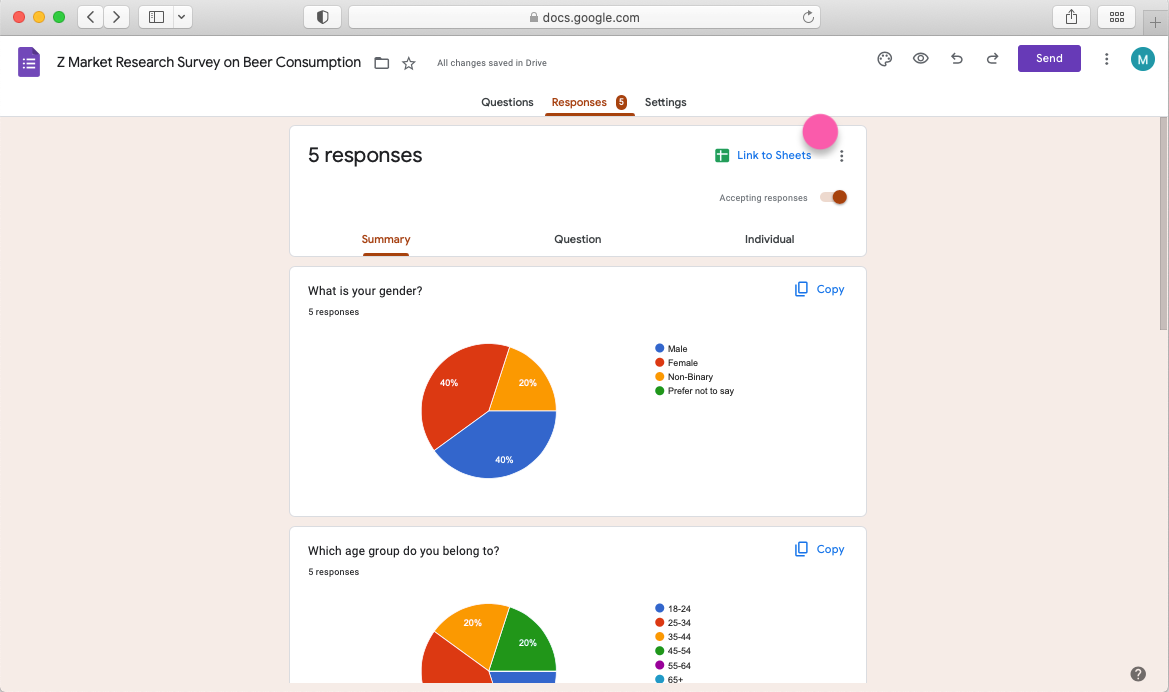
Choose between
Create a new spreadsheet or Select an existing spreadsheet. Step 2: Select Data
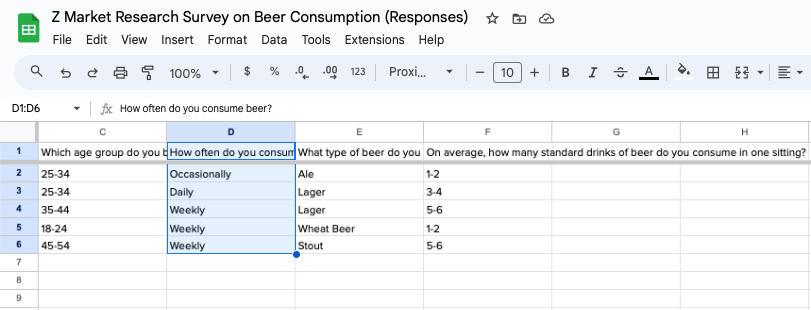
Highlight the cells you'd like to include in your chart.
Step 3: View Data as Chart
Click
Insert on the main menu followed by Chart.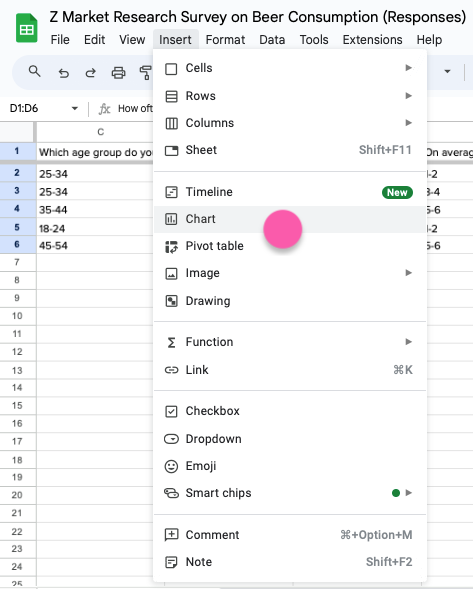
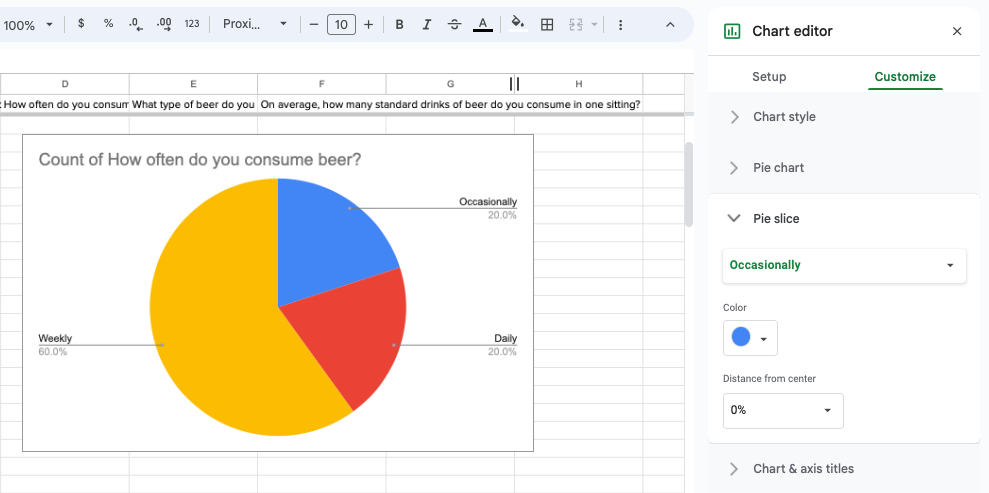
Step 4: Customize Your Chart
A Chart editor will appear on the right-hand side where you can edit your pie chart as you see fit.
Now you know how to make a pie chart in Google Forms with ease. Whether you're visualizing responses directly in the form or exporting data to Google Sheets, these steps ensure that your data is presented in a clear and concise manner. For a more comprehensive and visually engaging analysis of your form responses, you may want to explore Fillout forms. This user-friendly platform not only converts answers into pie charts but also offers the versatility of bar charts with an intuitive interface designed for easy review.

Written by
Dominic is the co-founder of Fillout.com. He previously worked on engineering & product at Retool. Prior to Retool, he started Cheer ( acquired by Retool in 2020).